Keep track of your sales & Revenue
Revenue VS Sales
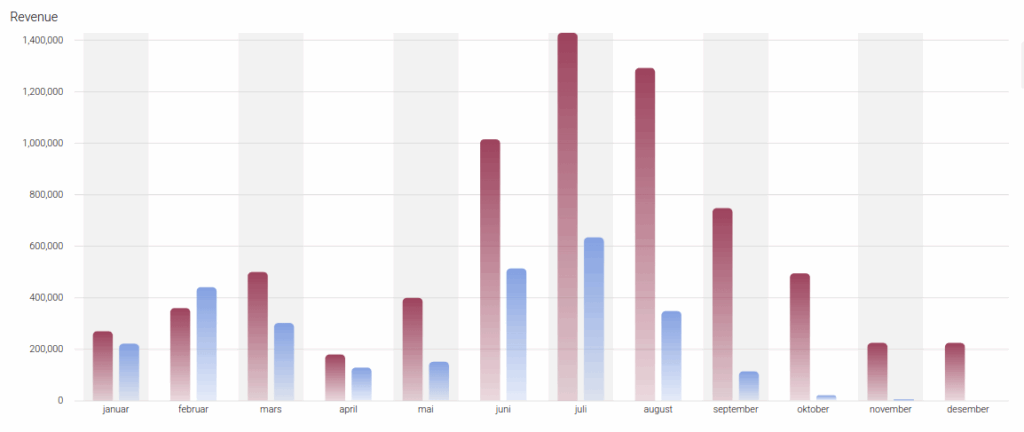
Understanding the difference between sales and revenue is essential — yet many people still find it challenging to separate the two.
Simply put, sales refers to what you actually sell, while revenue is the amount that gets recorded on your books. For example, you might sell rooms or reservations in January, but the revenue is recognized when the guests actually stay, say, in June.
Track your sales
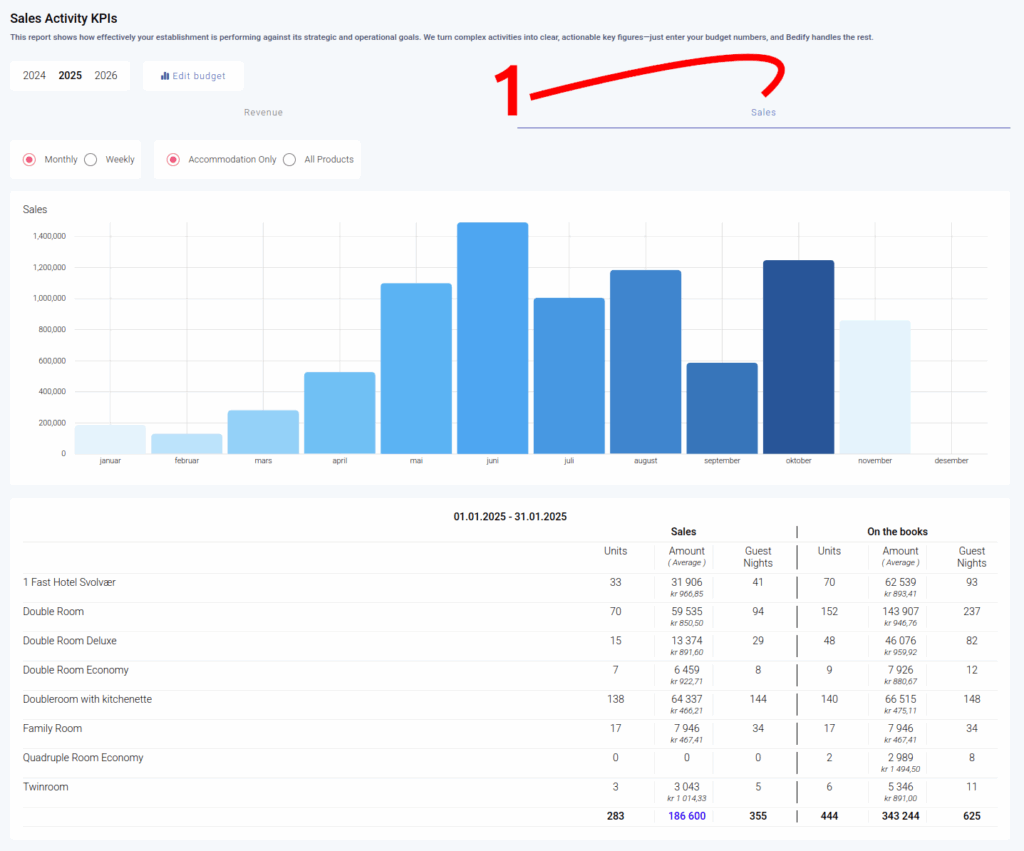
Go to Reports → Sales KPI and click on the Sales tab. You’ll see a graph that shows all your sales by month or week, based on your selection.
What can you take out from this report?
What insights can you get from this report?
Why is the sales report important?
This powerful tool helps you identify the months when your sales team needs to put in extra effort. For example, by looking at the graph, you can quickly see that there are fewer new bookings or reservations in January and February. Running campaigns during these months using the Bedify Campaign Module is a smart way to boost sales.
Once campaigns are launched, you can track their performance to see if the results meet expectations.
Additionally, by studying the numbers below the graph, you can see the average room price for each period. This is a valuable indicator for understanding how well you manage high- and low-priced rooms, which directly impacts your profitability.
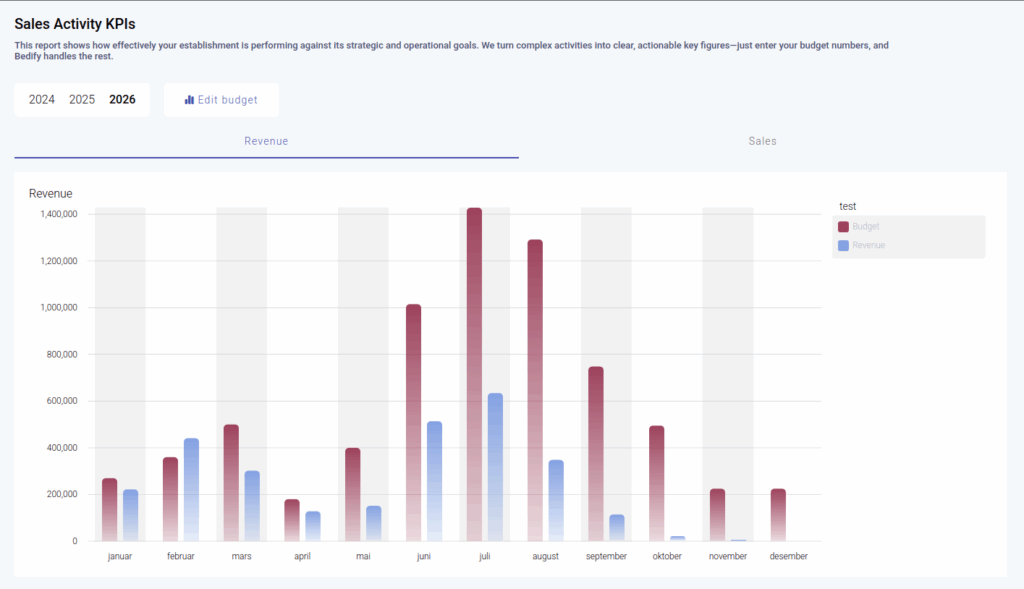
Revenue & Budget
Get a clear overview of how your revenue and budget are performing by checking the Economy Part of the report.
In the Sales KPI Report, you can set your budget for each month by entering the KPI numbers: revenue, room nights, and average nightly price. Once this is done, the graph provides an instant overview of your performance. Let the numbers speak for themselves—check the report regularly to see how you’re performing.
This report also gives you a forecast, helping you determine if you’re on track for the upcoming month or year.